

Get Started
Metrics
Reports
Report: Your Sites
Report: CrUX Dashboard
Report: CrUX Pages
Report: Pulse
Report: Pages Leaderboard
Report: Performance audits
Report: Snapshot Overview
Report: Accessibility audits
Report: Best Practices audits
Report: Long Task Timeline
Report: Metric Page
Report: SEO audits
Report: Single Page Test
Report: Third Party
CLI and API
Account and Billing
Integrations
Frequently Asked Questions
Report: Pages Leaderboard
The Pages Leaderboard allows to benchmark Pages within your Sites easily—find the fastest and slowest ones, as well as uncover potential areas for improvement. This article explains how to view and customise the Pages Leaderboard.
Pages Leaderboard tracks Web Vitals metrics by default. You can adjust the three metrics to your needs. All changes are saved for your account only, not Site or Organisation-wide.
View your Pages Leaderboard
- To view your Pages Leaderboard, go to Site → Synthetic → Pages in the main navigation. The Pages Leaderboard lists all of your Pages with accompanying Test Profiles.
- Filter by device type (all, desktop and mobile) to narrow down the testing conditions and find issues specific to certain environments.
- Use search underneath the main navigation to find a particular Page quickly.
- Order Pages ascending or descending, click on the relevant heading (such as a selected metric).

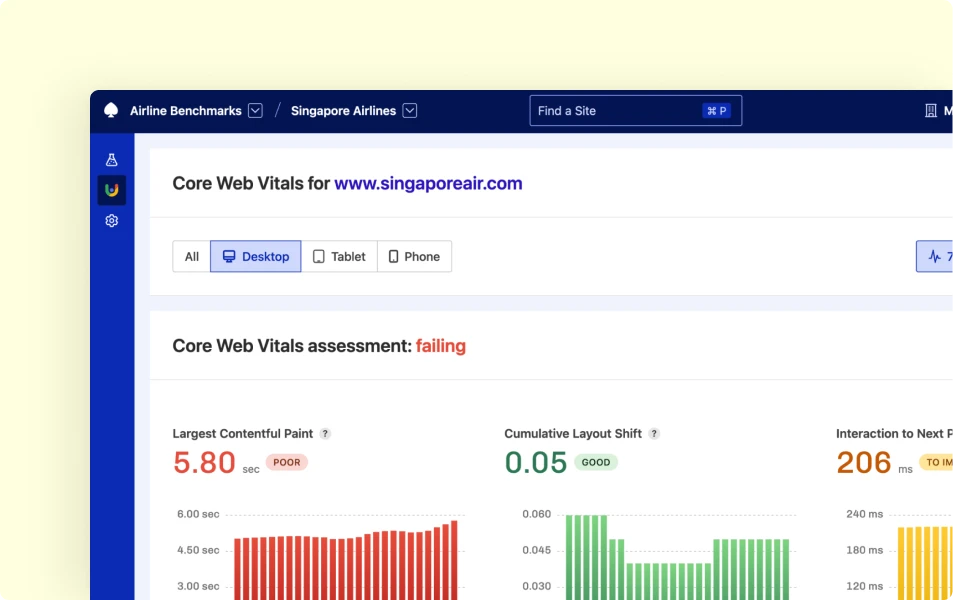
Each Page is listed with three selected metrics and historical data (from the 15 most recent Snapshots). Measurements are colour-coded, so you will know if a given area needs more work:
- Green: Good
- Yellow: Needs improvement
- Red: Poor
When a metric could not be obtained or calculated, a metric chart might be missing a single bar, or a “No data” label will be present. Historical data might also not be present for new Pages that have not been tested yet.
Customise displayed metrics
You can change the three displayed metrics according to what’s vital to your context.
- To edit a metric, click the Customise button, and then the Change metric button on a measurement you’d like to replace.
- Choose from all metrics that are available in Calibre. To make it easier to select a comprehensive set, metrics are categorised depending on the area they measure (for example, paint or runtime). The most critical metrics are listed as recommended—you can expand to the full list by clicking Show all metrics.
- After choosing and saving the selected new metric, your Pages page will display data accordingly.
